THR Charts: Hollywood's Box Office Tracking Explained
Michael Chang ·
Listen to this article~4 min

THR Charts from The Hollywood Reporter are essential tools for entertainment professionals. This guide explains how to use box office, streaming, and audience data to navigate the industry and make informed decisions.
You know that feeling when you're scrolling through entertainment news and you see those little charts from The Hollywood Reporter? The ones that track box office numbers, streaming rankings, and audience buzz? Those are THR Charts, and they're more than just numbers on a page.
They're the pulse of the entertainment industry. For professionals working in film, television, and streaming, understanding these charts isn't just helpful—it's essential. It's the difference between guessing what's working and knowing it.
Let's break down what makes THR Charts so valuable for anyone in the business.
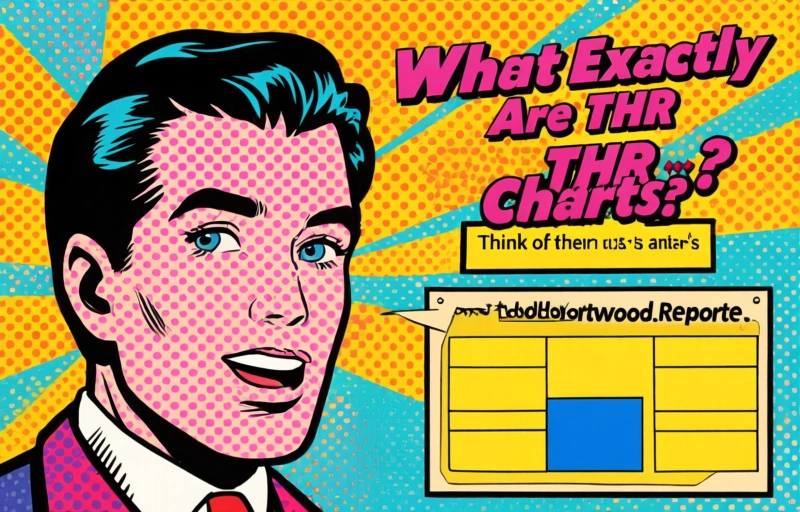
### What Exactly Are THR Charts?
Think of them as the industry's report card. The Hollywood Reporter compiles data from theaters, streaming platforms, and social media to create clear, visual snapshots of what's resonating with audiences. It's not just about who made the most money on opening weekend (though that's a big part of it). It's about trends, longevity, and cultural impact.
You'll find charts tracking everything from the top-grossing films of the week to the most-watched shows on streaming services. They help answer the questions everyone is asking: Is this movie a hit? Is that show finding its audience? Where is the momentum right now?
For a producer, director, or studio executive, this data is gold. It informs decisions about marketing budgets, release strategies, and even what kinds of projects to greenlight next. Ignoring these charts is like sailing a ship without a compass.
### Why Industry Pros Rely on This Data
In an industry driven by both art and commerce, data provides a crucial anchor. THR Charts offer an objective measure of success in a subjective business. Here's what professionals look for:
- **Weekend Box Office Rankings:** The immediate measure of a theatrical release's performance. It shows opening power and audience draw.
- **Streaming Top 10s:** With so much content moving online, these charts reveal what's cutting through the noise on platforms like Netflix, Hulu, and Disney+.
- **Award Season Trackers:** As Oscars or Emmys season heats up, charts track which films and shows are gaining critical momentum.
- **Social Media Buzz:** Some charts measure conversation volume and sentiment online, showing what people are actually talking about.
This isn't about reducing art to a spreadsheet. It's about understanding the relationship between a creative project and its audience. That understanding is power.
As one veteran agent once told me over coffee, "You can have the best script in town, but if you don't understand how it fits into the current landscape, you're just shouting into the void." THR Charts help define that landscape.
### How to Use Charts in Your Daily Work
So how do you actually apply this? It's simpler than you might think. First, make a habit of checking the key charts relevant to your niche every Monday morning. Look for patterns, not just individual winners.
Is there a genre that's consistently performing well? Are audiences leaning toward shorter series or epic sagas? Are certain stars reliably drawing crowds? These trends can shape your pitches, your projects, and your partnerships.
Remember, data is a tool, not a tyrant. The most successful professionals use charts to inform their instincts, not replace them. They combine the hard numbers with their own creative vision and understanding of storytelling.
At the end of the day, THR Charts provide a common language. When everyone in a meeting is looking at the same data, conversations become more focused and productive. You're not just arguing opinions—you're discussing measurable realities.
That's the real value. In a business that often feels unpredictable, these charts offer a bit of clarity. They help you navigate the chaos, make smarter decisions, and ultimately, tell stories that find their audience. And isn't that what we're all here to do?